
Category:Charts showing data through 2023
Deutsch: Statistiken bis zu und einschließlich 2023. Viele Grafiken fehlen hier noch – bitte hinzufügen.
English: Charts showing data up to and including 2023.
- Many charts are still missing – please help categorizing charts, e.g. from here. Outdated charts can often be updated. Only charts on notable subjects with specified data source(s) should be included.
| NO WIKIDATA ID FOUND! Search for Charts showing data through 2023 on Wikidata | |
| Upload media |
Subcategories
This category has the following 3 subcategories, out of 3 total.
C
- CWS metrics charts (7 F)
Media in category "Charts showing data through 2023"
The following 194 files are in this category, out of 194 total.
-
1880- Global surface temperature - heat map animation - NASA SVS.webm 30 s, 3,840 × 2,160; 35.15 MB
-
 1940-2023 Global surface temperature - stacked - Copernicus.jpg 3,060 × 1,980; 381 KB
-
 2023 climate change related Earth system records.jpg 1,750 × 2,366; 591 KB
-
 24-Hour CSP Monthly Averages South Africa 2023.png 2,184 × 1,238; 299 KB
-
 24-Hour Solar Monthly Averages South Africa 2023.png 2,185 × 1,234; 289 KB
-
 24-Hour Wind Monthly Averages South Africa 2023.png 2,179 × 1,235; 278 KB
-
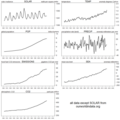 7 world series from our world in data.png 1,116 × 1,115; 81 KB
-
 Active editors at the English Wikipedia 2001–2023.png 1,568 × 1,246; 145 KB
-
Annual Arctic Sea Ice Minimum Area 1979-2023, With Graph (SVS5170 - sea ice min w graph 2023 2160p30).webm 46 s, 3,840 × 2,160; 96.83 MB
-
 Annual peak demand South Africa 2023.png 2,191 × 1,237; 203 KB
-
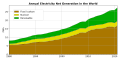 Annual world electricity net generation.svg 1,024 × 512; 36 KB
-
 Antarctic-sea-ice-extent 2016-2023.jpg 1,240 × 640; 135 KB
-
 Anzahl verkaufter Fahrräder und Ebikes in De bis 2022.svg 620 × 319; 54 KB
-
.svg/120px-Arrivals_into_the_EU_via_the_Mediterranean_from_2008_onwards_(UNHCR).svg.png) Arrivals into the EU via the Mediterranean from 2008 onwards (UNHCR).svg 1,728 × 878; 45 KB
Arrivals into the EU via the Mediterranean from 2008 onwards (UNHCR).svg 1,728 × 878; 45 KB
-
 Average Monthly Capacity Factor South Africa 2023.png 2,192 × 1,233; 219 KB
-
.png/120px-Average_pageviews_for_illustrated_and_unillustrated_articles_(all_languages).png)
-
 Average Weekly EAF South Africa 2023.png 2,163 × 1,236; 336 KB
-
 Bestand an Fahrrädern in De bis 2023.svg 605 × 340; 46 KB
-
 BEVsSales-2010-2023ByCountry.png 1,063 × 868; 756 KB
-
 Capacity & global costs South Africa 2023.png 2,202 × 1,240; 263 KB
-

-
 Chile energy mix.svg 850 × 600; 30 KB
-

-
 Climate-change.png 3,400 × 2,400; 869 KB
-
 ClimateDashboard-Antarctic-sea-ice-summer-minimum-graph-20230307-1400px.jpg 1,400 × 1,200; 252 KB
-
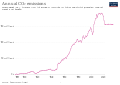 CO2 emissions Argentina.svg 850 × 600; 28 KB
-
 CO2 emissions Canada.svg 850 × 600; 29 KB
-
 CO2 emissions Denmark.svg 850 × 600; 35 KB
-
 CO2 emissions EU.svg 850 × 600; 39 KB
-
 CO2 emissions Finland.svg 850 × 600; 32 KB
-
 CO2 emissions Germany.svg 850 × 600; 39 KB
-
 CO2 emissions India.svg 850 × 600; 31 KB
-
 CO2 emissions Indonesia.svg 850 × 600; 29 KB
-
 CO2 emissions Italy.svg 850 × 600; 32 KB
-
 CO2 emissions Japan.svg 850 × 600; 31 KB
-
 CO2 emissions Mexico.svg 850 × 600; 32 KB
-
 CO2 emissions Netherlands.svg 850 × 600; 35 KB
-
 CO2 emissions Norway.svg 850 × 600; 37 KB
-
 CO2 emissions of Brazil.svg 850 × 600; 27 KB
-
 CO2 emissions of China.svg 850 × 600; 26 KB
-
 CO2 Emissions of France.svg 850 × 600; 37 KB
-
 CO2 emissions Saudi Arabia.svg 850 × 600; 24 KB
-
 CO2 emissions South Korea.svg 850 × 600; 27 KB
-
 CO2 emissions Spain.svg 850 × 600; 35 KB
-
 CO2 emissions Sweden.svg 850 × 600; 34 KB
-
 CO2 emissions Switzerland.svg 850 × 600; 32 KB
-
 CO2 emissions Turkey.svg 850 × 600; 31 KB
-
 CO2 emissions UK.svg 850 × 600; 43 KB
-
 CO2 emissions USA.svg 850 × 600; 38 KB
-
 CO2 Total Emissions By Region 2000-2023.png 1,200 × 1,000; 74 KB
-
 Co2-long-term-concentration.png 3,400 × 2,400; 655 KB
-
 Coal-Consumption-In-India.png 3,400 × 2,400; 358 KB
-
 Commons Growth.svg 800 × 600; 35 KB
-
 CoronavirusdataexplorerVietnam.svg 850 × 600; 63 KB
-
 COVID-19-World-vaccination-log.svg 720 × 459; 123 KB
-
 Daily COVID-19 vaccine doses administered in Vietnam.svg 850 × 600; 51 KB
-
 De.wikipedia Aktive Autoren 2001 bis August 2023.png 1,188 × 540; 90 KB
-
 De.wikipedia Alle Autoren 2001 bis August 2023.png 1,188 × 540; 97 KB
-
 Egg index.webp 4,277 × 1,348; 56 KB
-
.svg/120px-Einwohnerentwicklung_von_Vahrenwald-List_(Hannover).svg.png) Einwohnerentwicklung von Vahrenwald-List (Hannover).svg 800 × 400; 45 KB
Einwohnerentwicklung von Vahrenwald-List (Hannover).svg 800 × 400; 45 KB
-
 Electricity generation in Brazil by energy source.png 1,791 × 1,103; 130 KB
-
 Electricity generation in Germany by energy source.png 1,788 × 1,102; 144 KB
-
 Electricity generation in Ukraine by source and year.png 3,400 × 2,765; 815 KB
-
 Electricity in France.svg 725 × 480; 37 KB
-
 Electricity production by source, Mexico de.svg 850 × 600; 12 KB
-
 Electricity production in China.svg 850 × 600; 38 KB
-
 Electricity production in Sweden.svg 4,033 × 2,375; 62 KB
-
 Electricity production Serbia.png 3,400 × 2,765; 779 KB
-
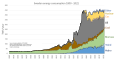
 Energy consumption by source by year in Ukraine.png 3,400 × 3,154; 1.06 MB
-
 Energy consumption by source, Australia.svg 850 × 600; 35 KB
-
 Energy consumption by source, Italy.svg 850 × 600; 37 KB
-
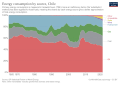
 Energy consumption by source, OWID.svg 850 × 600; 37 KB
-
 Energy consumption by source, Philippines.svg 850 × 600; 34 KB
-
 Energy consumption by source, Saudi Arabia.svg 850 × 600; 26 KB
-
 Energy consumption by source, Switzerland.svg 850 × 600; 37 KB
-
 Energy consumption by source, Turkey.svg 850 × 600; 34 KB
-
 Energy consumption India.svg 850 × 600; 37 KB
-
 Era5 global sfc temp monthly anomalies all months 1940-2023 dark.pdf 1,275 × 825; 98 KB
-
 Era5 global sfc temp monthly anomalies october 1940-2023.pdf 1,275 × 825; 90 KB
-
 Estimated Annual South African Embedded Solar South Africa 2023.png 2,186 × 1,233; 205 KB
-
 Estimated Provincial Embedded Solar South Africa 2023.png 2,190 × 1,235; 226 KB
-
 Estimated South African Embedded Solar South Africa 2023.png 2,193 × 1,237; 268 KB
-
 Estimated training cost of some AI models - 2024 AI index.jpg 2,560 × 1,361; 147 KB
-

-
.png/120px-Expectativa_de_vida_al_nacer_(1950-2023).png) Expectativa de vida al nacer (1950-2023).png 3,400 × 2,706; 483 KB
Expectativa de vida al nacer (1950-2023).png 3,400 × 2,706; 483 KB
-
 Försvarsutgifter i världen.svg 2,766 × 1,763; 46 KB
-
 Försvarsutgifter, procent av BNP.svg 2,765 × 1,832; 12 KB
-
 GBR rail passengers by year 1830-2023.png 1,023 × 571; 53 KB
-
-
 Global Temperature Anomaly.svg 1,440 × 1,000; 28 KB
-
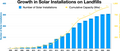 Growth in Solar Installations on Landfills.webp 3,810 × 1,608; 152 KB
-
 H5n1-flu-reported-cases.gif 3,400 × 2,700; 537 KB
-
 H5n1-flu-reported-cases.jpg 3,400 × 2,700; 311 KB
-
 H5n1-flu-reported-cases.png 3,400 × 2,668; 773 KB
-
 Hats ccl4 global.png 695 × 406; 57 KB
-
 Hats f11 global.png 695 × 405; 42 KB
-
 Hats f113 global.png 695 × 405; 37 KB
-
 Hats f12 global.png 695 × 405; 40 KB
-
 HATS Nitrous Oxide concentration.png 695 × 406; 57 KB
-
 Historical population of Sweden.svg 850 × 600; 48 KB
-
 Historical population of the Philippines.svg 850 × 600; 43 KB
-
 Historical population of the UAE.svg 850 × 600; 41 KB
-
 Historical population of Turkey.svg 850 × 600; 48 KB
-
 Historical population of Vietnam.svg 850 × 600; 45 KB
-
 Historical population of Yemen.svg 850 × 600; 49 KB
-
 Historical population of Zimbabwe.svg 850 × 600; 46 KB
-
 Kirchenaustritte Österreich.png 1,131 × 1,024; 146 KB
-
 Life expectancy in Somalia.png 3,400 × 2,765; 619 KB
-
 Life expectancy over time by world region, OWID.svg 850 × 647; 66 KB
-
 Life-expectancy, 1950 to 2023, ZWE.svg 850 × 691; 22 KB
-
 Load Shedding Hours South Africa 2023.png 2,146 × 1,232; 167 KB
-
 Load Shedding Hours with Stages South Africa 2023.png 2,173 × 1,237; 202 KB
-
 Load Shedding South Africa 2023.png 2,195 × 1,236; 242 KB
-
 Load Shedding Stage Hours South Africa 2023.png 2,183 × 1,231; 253 KB
-
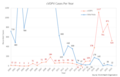
 M2, CPI, PCE.webp 3,853 × 1,006; 118 KB
-
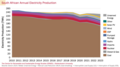
 Modern renewable energy generation by source, World.png 3,400 × 2,765; 625 KB
-
 Monkeypox cumulative-cases linear-plot.svg 850 × 600; 59 KB
-
 Monthly electricity production South Africa 2023.png 2,188 × 1,241; 299 KB
-
 Monthly-surface-temperature-anomalies-by-year.png 3,400 × 2,400; 2.2 MB
-
 Myanmar electricity imports.png 3,400 × 2,400; 339 KB
-
 Myanmar share of electricity production from fossil fuels.png 3,400 × 2,400; 305 KB
-
 Myanmar share of electricity production from hydropower.png 3,400 × 2,400; 327 KB
-
 Myanmar share of electricity production from solar.png 3,400 × 2,400; 320 KB
-
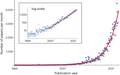
 Nanosatellites launched by years.png 2,560 × 1,440; 120 KB
-
NASA Summer 2023 Temperature Media Resources (SVS14407 - GISTEMP Curves Aug2023 English degC 2160p60).webm 30 s, 3,840 × 2,160; 14.1 MB
-
 Netherlands electricity generation by source.png 920 × 506; 57 KB
-
.png/120px-Neue_Artikel_pro_Tag_in_dewiki_02_(fcm).png) Neue Artikel pro Tag in dewiki 02 (fcm).png 1,587 × 965; 95 KB
Neue Artikel pro Tag in dewiki 02 (fcm).png 1,587 × 965; 95 KB
-
 Norden försvarsutgifter.svg 2,765 × 1,832; 21 KB
-
 Norden och rysslands försvarsutgifter.svg 2,765 × 1,832; 20 KB
-
 Nuclear Energy by Year.svg 1,072 × 593; 937 KB
-
 Nuclear energy, share of electricity production, OWID.svg 850 × 600; 42 KB
-
 Number of articles with and without images, across all languages.png 600 × 371; 18 KB
-
 Number of cVDPV cases since 2000.png 718 × 459; 43 KB
-
 Number of wild polio and cVDPV cases since 2000.png 717 × 521; 48 KB
-
 Pandemics-Timeline-Death-Tolls-OWID 9818.png 9,818 × 13,400; 2.58 MB
-
 Pandemics-Timeline-Death-Tolls-OWID 9818.webp 9,818 × 1,112; 798 KB
-
 Percentage illustrated articles.png 898 × 371; 15 KB
-
 Personal consumption expenditures price index.webp 3,853 × 1,020; 107 KB
-
 Photovoltaics Installed Capacity and Production in Australia.svg 614 × 461; 30 KB
-
 Photovoltaics Installed Capacity and Production in France.svg 614 × 461; 30 KB
-
 Photovoltaics Installed Capacity and Production in Greece.svg 614 × 461; 31 KB
-
 Photovoltaics Installed Capacity and Production in Turkey.svg 614 × 461; 27 KB
-
 Production & global costs South Africa 2023.png 2,177 × 1,235; 241 KB
-
 Renewable Energy Integration Impact in SOuth Africa 2023.png 2,181 × 1,229; 310 KB
-

-
.png/120px-Share-people-vaccinated-covid-(Spain).png) Share-people-vaccinated-covid-(Spain).png 3,400 × 2,400; 349 KB
Share-people-vaccinated-covid-(Spain).png 3,400 × 2,400; 349 KB
-
 SL, intäkter och skattefinansiering.svg 3,328 × 1,979; 31 KB
-
 South African Annual electricity production 2023.png 2,201 × 1,236; 238 KB
-
 South African Annual Energy Mix 2023.png 2,206 × 1,238; 276 KB
-
 South African total nominal capacity 2023.png 2,186 × 1,233; 252 KB
-
.png/120px-Spain_car_monthly_registrations_(1960-).png) Spain car monthly registrations (1960-).png 2,550 × 1,200; 139 KB
Spain car monthly registrations (1960-).png 2,550 × 1,200; 139 KB
-
 Stromerzeugung in Deutschland nach Energieträger.png 1,792 × 1,105; 153 KB
-
 Stromerzeugung in Japan nach Energieträger.png 1,792 × 1,103; 140 KB
-
 Stromerzeugung in Kernkraftwerken ab 1965.svg 640 × 427; 40 KB
-
 Stromerzeugung in Schweden nach Energieträger.png 1,793 × 1,111; 155 KB
-
 Stromerzeugung in Österreich nach Energieträger.png 1,794 × 1,102; 140 KB
-
 Strommix-deutschland-seit2015.svg 800 × 540; 107 KB
-
 Sulfur Hexafluoride concentration.png 695 × 406; 51 KB
-
 Sveriges elproduktion.svg 4,033 × 2,375; 62 KB
-
 Sveriges energikonsumtion.svg 3,854 × 2,103; 75 KB
-
 Sweden energy consumption.svg 3,637 × 2,100; 74 KB
-
 Tatoeba in machine translation articles.svg 540 × 360; 17 KB
-
 Temperature-anomaly.png 3,400 × 2,400; 818 KB
-
-
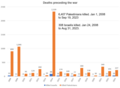 Timeline of Israel-Palestine fatalities 2008-2023.png 1,040 × 760; 41 KB
-

-

-
.tiff/lossy-page1-120px-Trend_toward_ever_larger_data_sets_in_astronomy_(noao1901b).tiff.jpg) Trend toward ever larger data sets in astronomy (noao1901b).tiff 2,820 × 1,824; 5.08 MB
Trend toward ever larger data sets in astronomy (noao1901b).tiff 2,820 × 1,824; 5.08 MB
-
 Trängselskatt i stockholm.svg 2,384 × 1,289; 10 KB
-
 Typical Day-Energy Production in South Africa 2023.png 2,205 × 1,235; 296 KB
-
 U.S - China - Russia, Military Spending.svg 2,766 × 1,763; 47 KB
-
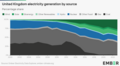 United Kingdom electricity generation by source.png 920 × 506; 62 KB
-
 Urbanization, 1750-2023.png 1,894 × 1,134; 219 KB
-
 US and UK enwiki views.png 551 × 455; 32 KB
-
 Världens försvarsutgifter.svg 2,766 × 1,763; 48 KB
-
 Wind power installed capacity and generation in Australia.svg 614 × 461; 32 KB
-
 Wind power installed capacity and generation in Denmark.svg 614 × 461; 40 KB
-
 Wind power installed capacity and generation in Finland.svg 614 × 461; 34 KB
-
 Wind power installed capacity and generation in Greece.svg 614 × 461; 30 KB
-
 Wind power installed capacity and generation in Ireland.svg 614 × 461; 33 KB
-
 Wind power installed capacity and generation in Italy.svg 614 × 461; 33 KB
-
 Wind power installed capacity and generation in Portugal.svg 614 × 461; 34 KB
-

-
 Wind power installed capacity and generation in Turkey.svg 614 × 461; 36 KB
-
 Wind power installed capacity in Argentina in MW.svg 614 × 461; 25 KB
-
 Wind power installed capacity in Australia MW.svg 614 × 461; 30 KB
-
 Wind power installed capacity in NL MW.svg 614 × 461; 40 KB
-
 Wind power installed capacity in Romania MW.svg 614 × 461; 25 KB
-
 Wind power installed capacity in UK MW.svg 614 × 461; 31 KB
-
 World elecrtic generation stacked source.png 2,400 × 1,500; 124 KB
-
 World electric generation treemap source country 2023.png 4,800 × 3,000; 1.32 MB
-
 World population growth, 1700-2100, 2022 revision.png 13,083 × 9,584; 1.46 MB
-
 Www23companion-49-fig10.jpg 545 × 328; 26 KB
-
 Www23companion-49-fig11.jpg 544 × 328; 37 KB


.svg)

.png)


.svg)


.png)


.png)


.png)


.png)


