The Data Science Lab
Clustering Non-Numeric Data Using C#
Clustering non-numeric -- or categorial -- data is surprisingly difficult, but it's explained here by resident data scientist Dr. James McCaffrey of Microsoft Research, who provides all the code you need for a complete system using an algorithm based on a metric called category utility (CU), a measure how much information you gain by clustering.
Clustering data is the process of grouping items so that items in a group (cluster) are similar and items in different groups are dissimilar. After data has been clustered, the results can be visually analyzed by a human to see if any useful patterns emerge. For example, clustered sales data could reveal that certain types of items are often purchased together, and that information could be useful for targeted advertising. Clustered data can also be programmatically analyzed to find anomalous items.
For completely numeric data, the k-means clustering algorithm is simple and effective, especially if the k-means++ initialization technique is used. But non-numeric data (also called categorical data) is surprisingly difficult to cluster. For example, suppose you have a tiny dataset that contains just five items:
(0) blonde   norway   male
(1) redhead  england  male
(2) gray     england  male
(3) blonde   spain    female
(4) gray     england  female
Each item represents a person and has three attributes: hair color, county, and gender. Even for this tiny dataset, it's not at all obvious how to group this data into two clusters so that people in each cluster are similar. In this article I present a complete system for clustering non-numeric data. The underlying algorithm is based on a metric called category utility (CU). The CU metric is a measure how much information you gain by clustering.
 [Click on image for larger view.] Figure 1: Clustering Non-Numeric Data Using C# in Action
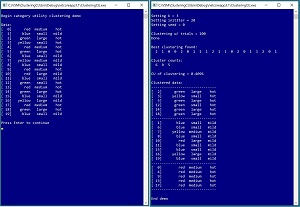
A good way to see where this article is headed and to understand category utility is to examine the screenshot of a demo program in Figure 1. The demo sets up and displays a 20-item dataset. Each data item has three attributes: color (red, blue, green, yellow), size (small, medium, large), and temperature (mild, hot). Behind the scenes, the demo converts each string data value into a 0-based index value. For example, the size values are encoded as medium = 0, small = 1, large = 2.
The demo prepares to cluster the data by setting the values of four parameters. The number of clusters is set to k = 3. The number of times to iterate during the clustering initialization process is set to initIter = 20. A seed value for a random number generator is set to seed = 0. And the number of times to try different clustering, looking for the best result, is set to trials = 100. These four parameter values will be explained in more detail shortly.
After clustering completed, the result was displayed as [2, 1, 0, 0, . . 1]. This means data item [2] is in cluster 0, item [1] is in cluster 1, item [2] is in cluster 0, and so on, to item [19] in cluster 1. The cluster counts are (6, 9, 5) which means there are 6 data items assigned to cluster 0, 9 items assigned to cluster 1, and 5 items assigned to cluster 2.
The value of the category utility of the clustering is CU = 0.4096. Values of CU will be between 0.0 and 1.0 where larger values of CU are better. The demo concludes by displaying the string data organized by clusters. Cluster 0 could be described as a "green-hot" cluster. Cluster 1 is a "mild" cluster. And cluster 2 is a "red-medium-hot" cluster. If you look at the data carefully you should get an intuitive notion that the clustering makes sense.
In order to use the code presented here with your own data you must have intermediate or better programming skill with a C-family language. In order to significantly modify the demo algorithm you must have expert level programming skill. This article doesn't assume you know anything about clustering or category utility. The demo is coded in C# but you shouldn't have too much trouble refactoring the code to another language if you wish. The source code for the demo program is too long to be presented in its entirety in this article but the complete code is available in the accompanying file download.
Understanding Category Utility
The category utility (CU) of a given clustering of a dataset is a numeric value that reflects how good the clustering is. Larger values of CU indicate a better clustering. If you have a goodness-of-clustering metric such as CU, then clustering can be accomplished in several ways.
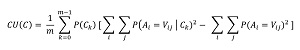
The math definition of CU is shown in Figure 2. The equation looks intimidating but is simpler than it appears. In the equation, C is a clustering, A is an attribute, such as "color", and V is a value, such as "red". Lower case k is an index variable for each cluster ID, and lower case "m" is used for the number of clusters. (The equation uses "m" rather than "K" to avoid confusion with "k".)
 [Click on image for larger view.] Figure 2: Math Equation for Category Utility
The CU equation has two double-summation terms. The right-hand summation is called the unconditional term. It represents the amount of order in the entire dataset. The left-hand summation is called the conditional term. It represents the amount of order in the clustered dataset. The difference between the two summations represents the amount of order you gain by clustering the data. The P(Ck) and 1/m terms are weights to account for different numbers of data items in each cluster, and the number of clusters used.
Calculating CU is best explained by example using a small dataset. Suppose your source data is the dataset presented above, with just five items where each item has three attributes:
[0] blonde   norway   male
[1] redhead  england  male
[2] gray     england  male
[3] blonde   spain    female
[4] gray     england  female
And suppose you cluster the data into k = 2 clusters like so:
k = 0
[0] blonde   norway   male
[3] blonde   spain    female

k = 1
[1] redhead  england  male
[2] gray     england  male
[4] gray     england  female
The CU value of this particular clustering is CU = 0.3733. First, the value of the right-hand double summation is calculated as:
blonde:   (2/5)^2 = 0.160
redhead:  (1/5)^2 = 0.040
gray:     (2/5)^2 = 0.160

norway:   (1/5)^2 = 0.040
england:  (3/5)^2 = 0.360
spain:    (1/5)^2 = 0.040

female:   (2/5)^2 = 0.160
male:     (3/5)^2 = 0.360

sum =               1.320
This sum is an indirect representation of how well you could do by guessing values without any clustering. You can think of this as the amount of order in the data. For example, for an unknown item, if you guessed the hair color attribute is "blonde," your probability of being correct is 2/5.
Next, the left-hand double summation is calculated similarly except that you compute a sum for each cluster separately. For cluster k = 0:
blonde:   (2/2)^2 = 1.000
redhead:  (0/2)^2 = 0.000
gray:     (0/2)^2 = 0.000

norway:   (1/2)^2 = 0.250
england:  (0/2)^2 = 0.000
spain:    (1/2)^2 = 0.250

male:     (1/2)^2 = 0.250
female:   (1/2)^2 = 0.250

sum =               2.000
And then for cluster k = 1:
blonde:   (0/3)^2 = 0.000
redhead:  (1/3)^2 = 0.111
gray:     (2/3)^2 = 0.444

norway:   (0/3)^2 = 0.000
england:  (3/3)^2 = 1.000
spain:    (0/3)^2 = 0.000

female:   (1/3)^2 = 0.111
male:     (2/3)^2 = 0.444

sum =               2.111
These two sums are also indirect measures of how well you could do by guessing values, or equivalently the amount of order due to the clustering. At this point you could just use the difference between the two summations as a measure of the increase in order you get by clustering. But this approach is too simple because it doesn't take into account the number of items in each cluster, or the number of clusters used.
The P(Ck) values in the equation means, "probability of cluster k." Because cluster k = 0 has 2 items and cluster k = 1 has 3 items, the two P(C) values are 2/5 = 0.40 and 3/5 = 0.60 respectively. The P(Ck) values adjust for cluster size. The 1/m term is a scaling factor that takes the number of clusters into account. For the tiny dataset m = 2 so 1/m = 1/2.
Putting the two summations and two weights together gives the value of CU for the clustering:
CU = 1/2 * (0.40 * (2.000 - 1.320) + 0.60 * (2.111 - 1.320))
   = 1/2 * (0.272 + 0.475)
   = 0.3733
Ideas similar to category utility have been around for decades. To the best of my knowledge, the definition of CU that I use was first described in a 1985 research paper by M. Gluck and J. Corter.
The Demo Program
To create the demo program, I launched Visual Studio 2019. I used the Community (free) edition but any relatively recent version of Visual Studio will work fine. From the main Visual Studio start window I selected the "Create a new project" option. Next, I selected C# from the Language dropdown control and Console from the Project Type dropdown, and then picked the "Console App (.NET Core)" item.
The code presented in this article will run as a .NET Core console application or as a .NET Framework application. Many of the newer Microsoft technologies, such as the ML.NET code library, specifically target .NET Core so it makes sense to develop most new C# machine learning code in that environment.
I entered "ClusteringCU" as the Project Name, specified C:\VSM on my local machine as the Location (you can use any convenient directory), and checked the "Place solution and project in the same directory" box.
After the template code loaded into Visual Studio, at the top of the editor window I removed all using statements to unneeded namespaces, leaving just the reference to the top-level System namespace and the Collections.Generic namespace. In a non-demo scenario you'll likely need the System.IO namespace to read data into memory from a text file. The demo needs no other assemblies and uses no external code libraries.
In the Solution Explorer window, I renamed file Program.cs to the more descriptive ClusteringCUProgram.cs and then in the editor window I renamed class Program to class ClusteringCUProgram to match the file name. The structure of the demo program, with a few minor edits to save space, is shown in Listing 1.
Listing 1. CU Clustering Demo Program Structure
using System;
using System.Collections.Generic;
// using System.IO;

namespace ClusteringCU
{
  class ClusteringCUProgram
  {
    static void Main(string[] args)
    {
      Console.WriteLine("Begin demo");

      string [][] data = new string[20][];
      data[0] = new string[]
        { "red", "medium", "hot" };
      data[1] = new string[]
        { "blue", "small", "mild" };
      . . .
      data[19] = new string[]
        { "blue", "small", "mild" };

      Console.WriteLine("Data: ");
      ShowMatrix(data,
        new int[] { 8, 8, 7 }, true);

      Console.WriteLine("Hit Enter to continue");
      Console.ReadLine();

      int k = 3;
      int initIter = 20;
      int seed = 0;
      Console.WriteLine("Setting k = " + k);
      Console.WriteLine("Setting initIter = " +
        initIter);
      Console.WriteLine("Setting seed = " +
        seed);
      CatCluster cc = new CatCluster(data,
        k, initIter, seed);

      int trials = 100;
      Console.WriteLine("Clustering trials = " +
        trials);
      cc.Cluster(trials);
      Console.WriteLine("Done");

      Console.WriteLine("Best clustering: ");
      ShowVector(cc.clustering, 3);

      Console.WriteLine("Cluster counts: ");
      ShowVector(cc.counts, 3);

      Console.WriteLine("CU of clustering = " +
        cc.catUtil.ToString("F4"));

      Console.WriteLine("Clustered data: ");
      ShowClustered(data, k, cc.clustering,
        new int[] { 8, 8, 7 }, true);

      Console.WriteLine("End demo ");
      Console.ReadLine();
    }

    static void ShowMatrix(string[][] m,
      int[] wids, bool indices) { . . }

    static void ShowClustered(string[][] data,
      int K, int[] clustering, int[] wids,
      bool indices) { . . }

    static void ShowVector(int[] vec,
      int wid) { . . }

  } // class Program

  public class CatCluster
  {
    public int K;  // number clusters
    public string[][] data;  // "red"  "blue"  . .
    public int[][] ds;  // data converted to 0, 1,
    public double catUtil;  // best CU
    public int[] clustering;  // best clustering
    public int[] counts;  // num items each cluster
    public int initIter;  // find initial clusters
    public int N;  // total number data items
    public int dim;  // num elements each item
    private Random rnd;

    public CatCluster(string[][] data, int k,
      int initIter, int seed)
    {
      this.K = k;
      this.data = data;
      this.ds = Convert(data);  // strings to ints
      this.catUtil = -1.0;  // will always update
      this.N = data.Length;
      this.dim = data[0].Length;
      this.clustering = new int[this.N];
      this.counts = new int[k];  // one per cluster
      this.initIter = initIter;
      this.rnd = new Random(seed);
    }

    // public and private methods here

  } // class CatCluster
} // ns
All of the program control logic is contained in the Main() method. All of the clustering logic is contained in a class named CatCluster. The demo begins by setting up the source data:
string [][] data = new string[20][];
data[0] = new string[] {"red", "medium", "hot"};
data[1] = new string[] {"blue", "small", "mild"};
. . .
data[19] = new string[] {"blue", "small", "mild"};
The demo data is hard-coded and stored into an array-of-arrays style matrix. In a non-demo scenario you'd likely read your data into memory from a text file, using a helper function along the lines of:
string fn = "..\\..\\..\\Data\\my_data.txt";
double[][] string = MatLoad(fn, 20,
  new int[] { 0, 1, 2 }, '\t');